Let’s start with a quick overview of the OrgChart application. Designed with you in mind, it is easy to use and easy to learn. OrgChart lets you quickly build simple or very complex organizational charts.
Open a new OrgChart by pressing the File Tab and then the New button.

A new OrgChart will appear with a single component on screen.
Quick Start: Begin building
Set the Zoom level to 100% by clicking in the View tab and using the Zoom Toolbar and either picking 100% from the drop-down menu or using your mouse scroll wheel (recommended).

Go to the Chart Design Palette (on the left side of the screen) and open up the Components area (by clicking on the Components title bar). Scroll down the list of components and choose the component labeled Position.
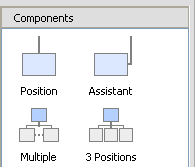
Holding down the Left mouse button, drag the Position icon from the Components area and drop it directly onto the on-screen component (an icon will indicate that the component is in the correct position).

Repeat this step until you have three subordinates. It will look like this:

Quick Start: Unique shapes
You now have a basic chart. But plain boxes are pretty boring, so let’s jazz things up by giving our components unique shapes for each level. Select the bottom three components by holding down the Left mouse buttonand dragging an area slightly larger than the components you want to select.

When you release the mouse button, the selected components will appear with dotted lines around them. (Note: sometimes they will also appear with either arrows or small boxes on each node – as in these illustrations – depending if you are in Move or Resize mode.)

Open up the Shapes area of the Chart Design Palette by clicking on Shapes.

Scroll down and select RectangleShape. Just as you did in Step 4, hold down the Leftmousebutton, drag the FolderShape icon from the Shapes area and drop it on to any of three highlighted components.

Now our chart has distinct shapes for each level, and each box has a drop shadow. If we want to remove the drop shadow, there are a few steps to take.
Quick Start: Additional formatting
Select all boxes using a mouse click-drag, or by pressing Ctrl-a. Then right click to bring up a local menu or pop-up menu.


The basic OrgChart is complete. Now let’s save it. To save your chart, go to the File tab and click on Save As.

Congratulations! You have just created an OrgChart in record time! When you are ready, move on to the next 5-minute segment where you will learn how to enter information into the chart you just created.