Org charts can be created by importing data, or they can be created manually by adding one box at a time. If you have decided to not use data import to create your chart then the tools in the Chart Design Palette will be of particular interest to you.
Chart Design Palette: Default display
The default installation should allow you to see the Chart Design pane on the left side of the interface. In this pane are Components, Shapes and Autotext items.
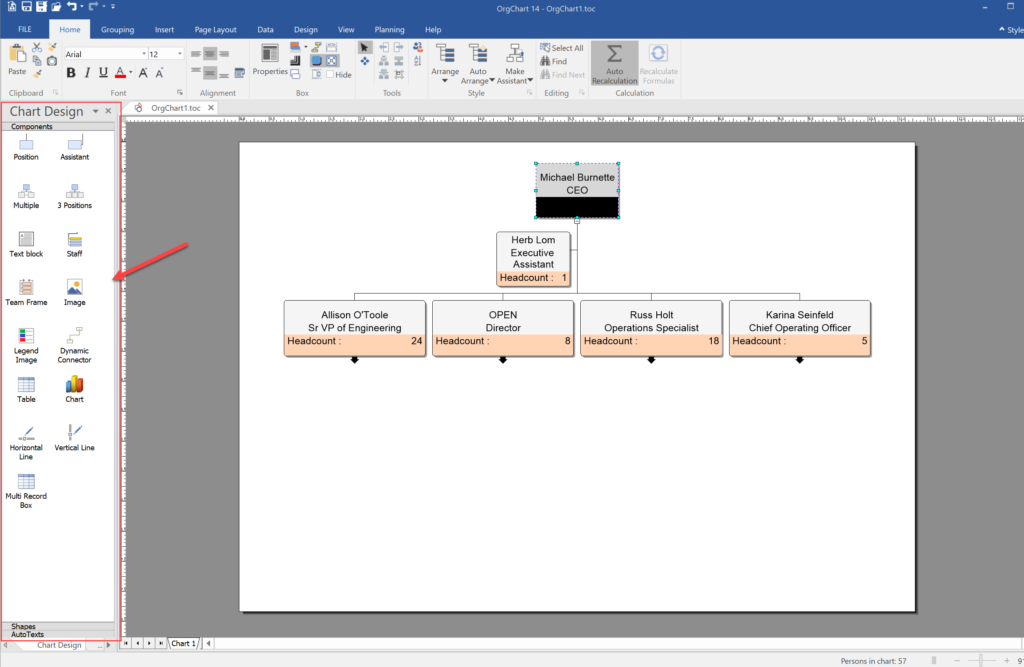
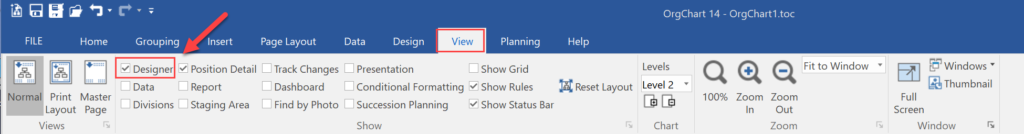
If you do not see the chart design pane on the left, go to the View tab and select Designer. The pane will then appear.
The Chart Design Palette contains the following three expandable areas:
Chart Design Palette: Components
- Components – the building blocks of a chart. Components can be moved, linked, hidden and resized. By default, they display an person’s Name and Title but can show an almost infinite range of information.
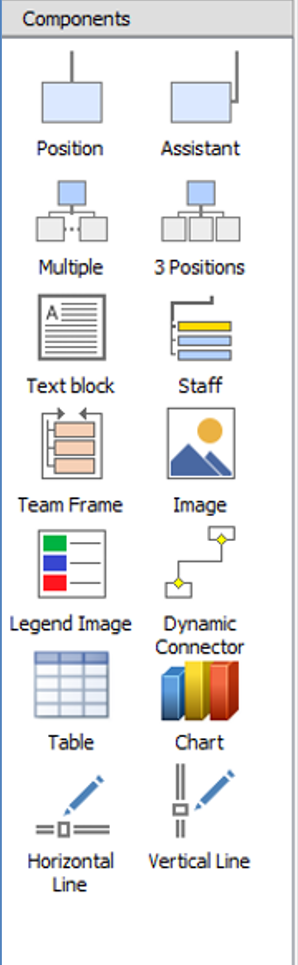
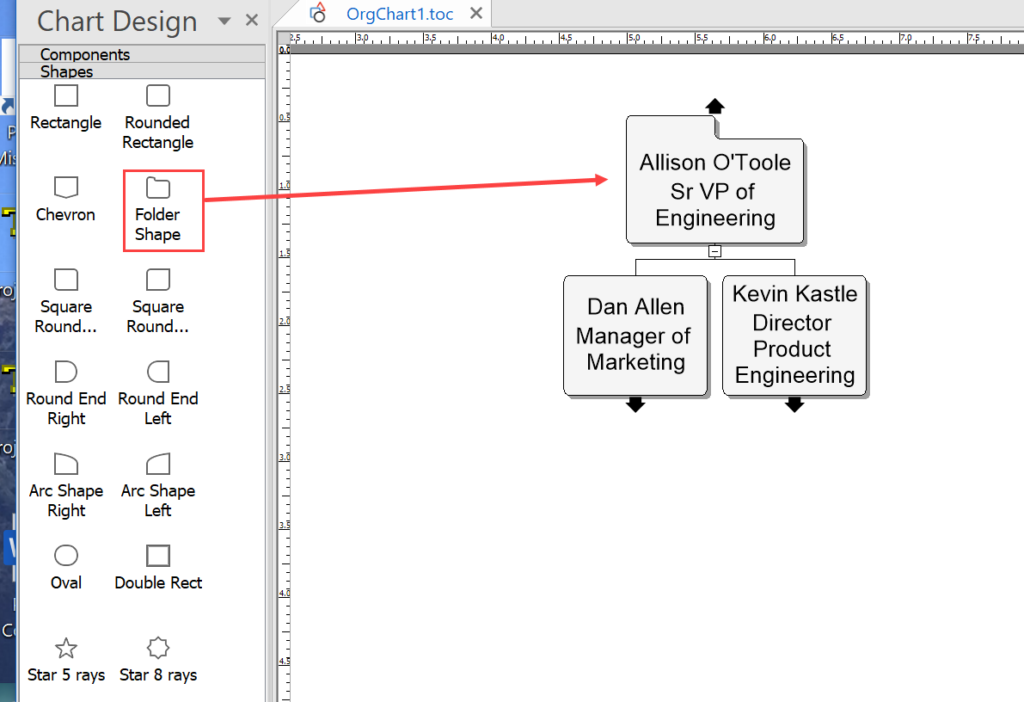
Chart Design Palette: Shapes
- Shapes – styles that modify a component’s shape. IMPORTANT: a shape can only be applied to components that are already present on the chart.
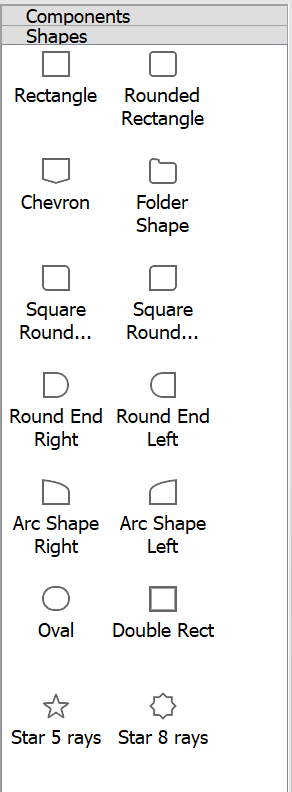
Chart Design Palette: AutoTexts
- AutoTexts – boxes which contain text and information which can be automatically applied to the chart and customized.
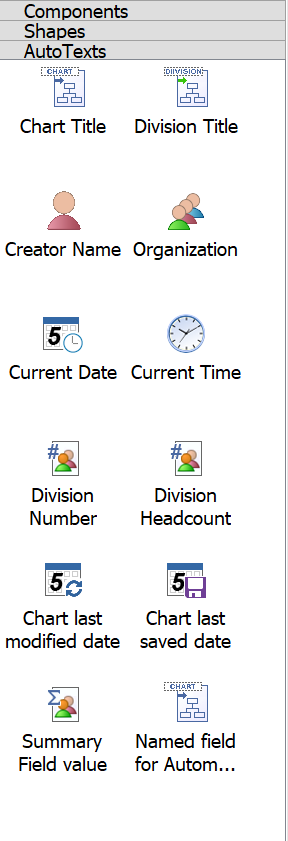
There are different kinds of Autotext fields that will come in handy.
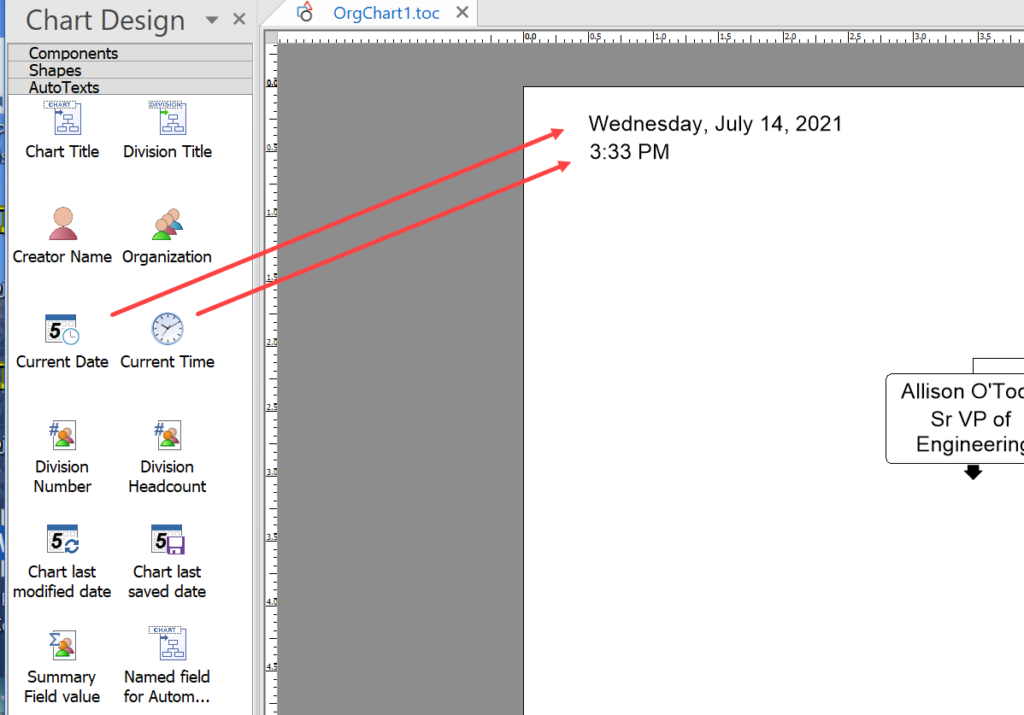
Example: Current time. This date is coming from your computer’s operating system. Drag the Current Time icon to the chart page to show current time. You may use this option to note when you last worked on your chart. The same applies to Current Date.
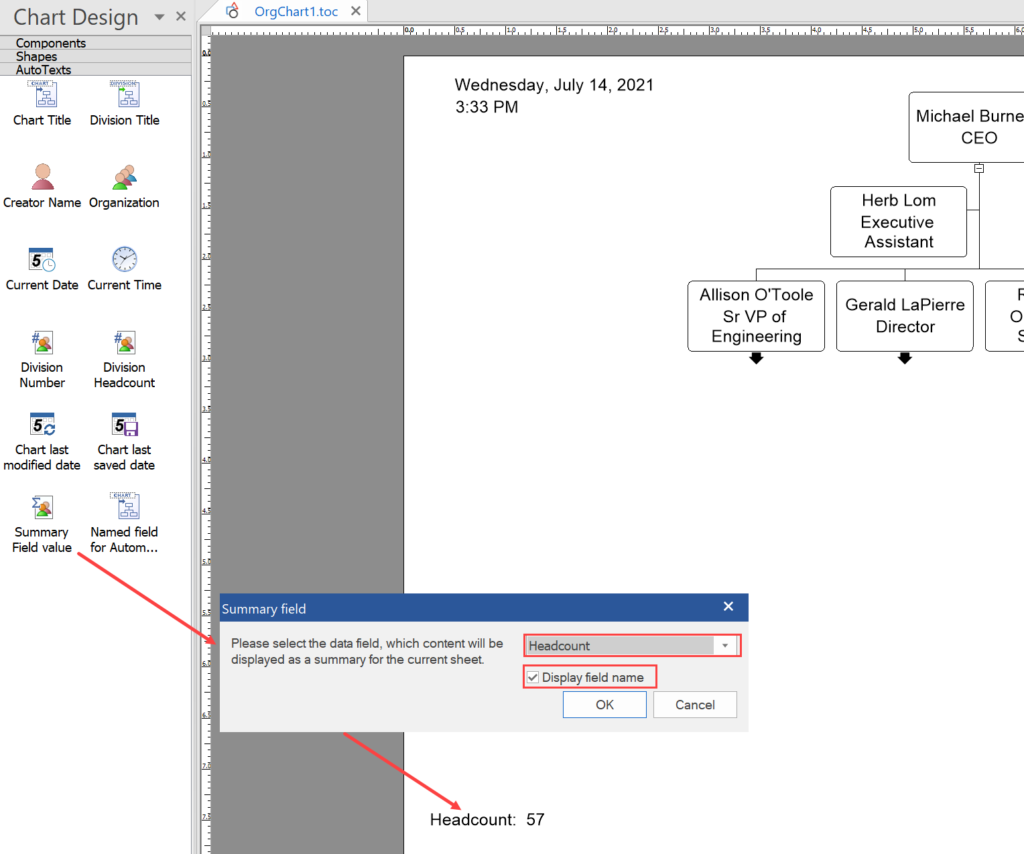
Example: Summary Field Value. Use this to show a computed amount such as the total headcount in a division or in the entire chart. Drag the icon to the chart page and complete the dialog.
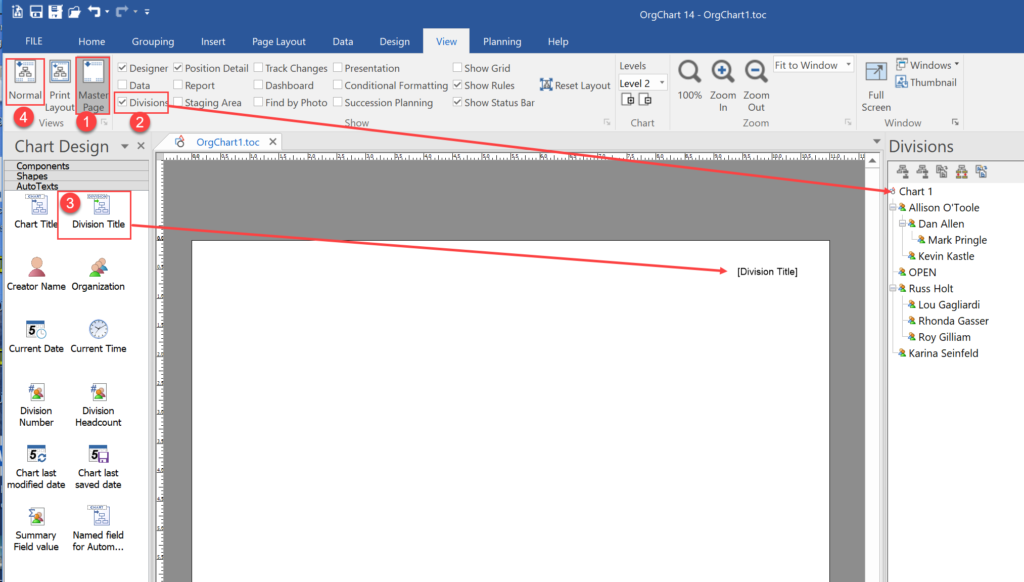
Example: Division Title. If you have a larger chart containing multiple divisions you can show the name of each division branch on the chart page. In this example there are four divisions. This means there are at least five pages in our chart. While the method of creating a Master page will be covered in another article we will touch on it so that you see how a label or Autotext placed on the Master page will show on all pages.
Chart Design Palette: Master page
Master Page. Under the View tab select Master, and also select Divisions. Drag the Division Title Autotext onto the chart page. Then click on Normal view.
Having used the Autotext command for Division Title, you now have the name of each manager on their own Division page.
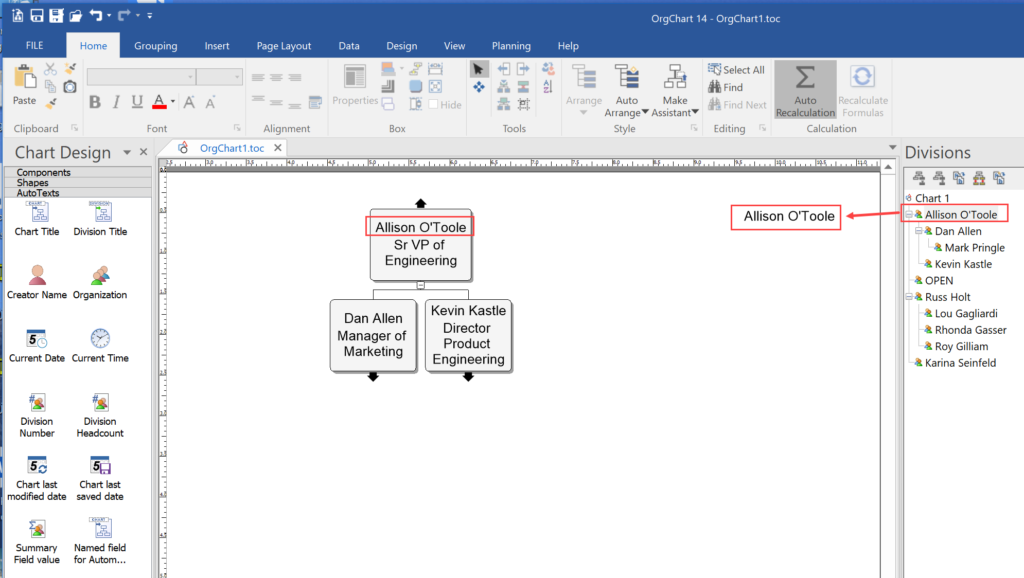
Autotext tools can save much repetitive work as you make your chart.
Chart Design Palette: Shapes
By dragging a shape onto a chart object you can change its shape.