The Data tab provides access to the data import and export wizards, as well as the Markers features and the Compare utility.
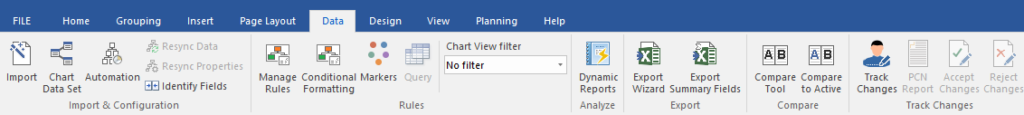
Data Tab: Import and configuration
- Import – Perhaps the most powerful feature of OrgChart. This command starts the Import Wizard and allows import of various file types to automatically create the chart.
- Chart Data Set – Opens the chart’s database. From this dialog you can add fields and calculations, or change the name of any data field. Note: Any changes made in the Chart Data Set impact the entire chart file, nor just a single box. Any field added becomes available to all boxes in the chart file.
- Automation – This wizard configures a script for automating the organization chart update and publishing process. The script that is produced from this procedure includes two files; a .bat file and a .ini specifications file. Together these files can be used with Windows Task Scheduler to kick off functions such as data resync and publishing report outputs.
- Resync Data – If External data has been changed this option will update the chart database. Only if data has been imported is Resync Data an option.
- Resync Properties – Resync Properties are the configuration options for Resync Data.
- Identify Fields – Identify any/all data field mapping from import fields to predefined Orgchart fields used in Box or Chart Templates.
Data Tab: Rules
- Manage Rules – Rules are a very powerful way to search, format and change the structure of the organization chart. Creating custom rules makes for a more efficient, repeatable and tailored planning process.
- Markers – let you color boxes based on data values present in each box. Markers set the possible box colors, and Rules set the data conditions under which the Markers are applied. Markers and Rules work together. You must define a Rule if you want to apply a color Marker to boxes.
- Conditional Formatting – a box format style can be configured based upon a rule to instantly respond to a change in data.
- Query – Query function allows users to narrow the scope of their charts, displaying only one department or branch of the chart at a time.
Data Tab: Analyze
- Dynamic Reports – A flexible, interactive report writer that can sort, filter, group and summarize on the fly. Results of the report can be exported to Excel for additional operations or published to PDF.
Data Tab: Export
- Export – This command starts the Export Wizard. Any data that is imported, calculated or added manually to the chart can be exported to Excel or a database.
- Export Summary Fields – Any hierarchical totals for calculations can be exported.
Data Tab: Compare
- Compare Tool – This utility will compare any two chart files allowing you to see any and all record and field differences.
- Compare to Active – Lets you compare any chart file to the one that is currently open and in view.
Data Tab: Track changes
- Track Changes – This enables identification of any fields that change, or records added or records deleted. Results show in a separate pane titles ‘Change Tracking’. Current values, prior values and author are included in the tracking.
- PCN Report – After any change the Personnel Change Notification document is generated for management approval.
- Accept Changes – cumulative changes are itemized in the tracking pane. These changes can be accepted in bulk.
- Reject Changes – Or changes can be rejected in bulk.