The Default Options screen is used to set certain global defaults in OrgChart. It is comprised of the General and Default Fields Set screens. To access the Options screen – go to File Tab, then Options.
Options Screen: General

- Start: Open the previous OrgChart project at each application launch. Suggested for users frequently editing a limited number of organizational charts.
- Welcome: Present the application startup dialog at each application launch. Typically unchecked once users become familiar with OrgChart.
- Wizard: Default behavior to provide a starting description for users who are not familiar with Wizard actions.
- Find: Default settings for search messaging.
Options Screen: User information

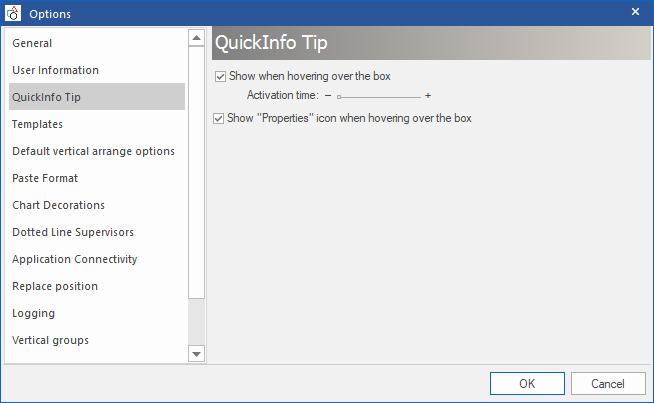
Options Screen: QuickInfo tip
Options Screen: Templates
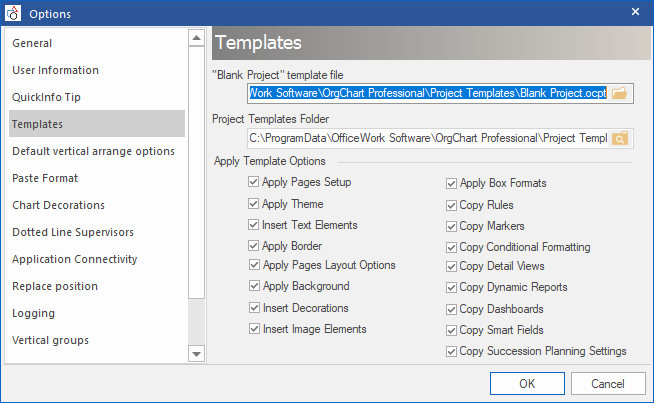
Templates are predefined OrgChart settings used as starting blocks for the most common attributes of an OrgChart project.
- File and Folder specify a default filename and subdirectory location for your Templates.
- Template Options provide a comprehensive list of include/exclude OrgChart attributes saved with each Template file. Template files do not include imported or added data sets.
Options Screen: Vertical arrange options

Default Vertical Arrange options applies to boxes using the vertical arrangement style.
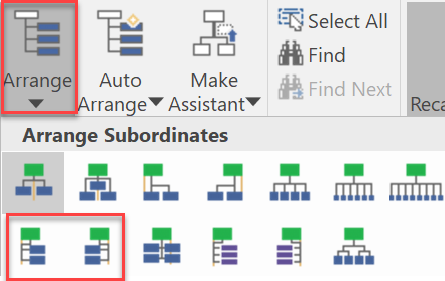
When using vertical hanging arrangements, these options will be applicable.

Bottom Pin Shift. Example: Bottom pin shift 50%.

Box Shift: Example: Box Shift 50%.
Options Screen: Paste format
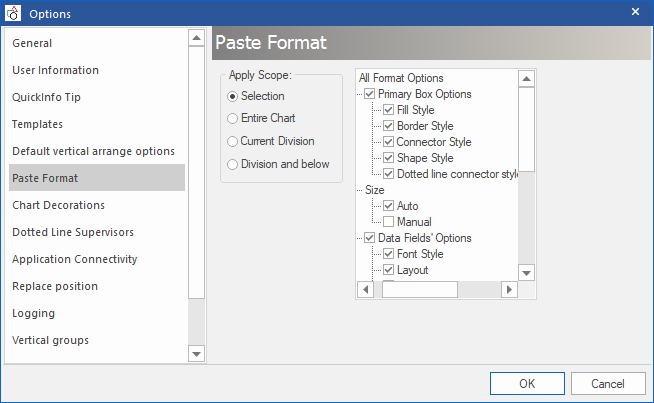
- Apply Scope: Paste operations apply to the destination Selection, the entire OrgChart, current selected Division, or current selected Division and all Divisions below.
- Format Options: Comprehensive list of Paste attributes included in each Paste operation.
Options Screen: Chart decorations
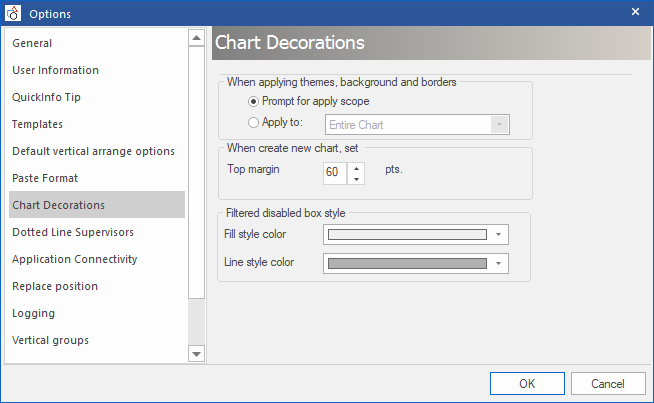
- When Applying Themes: This option controls the scope of application.
- When creating a new chart: This option lets you set the top margin (the number pixels between the top of the chart and the top of the page).
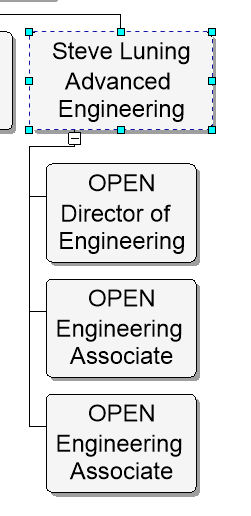
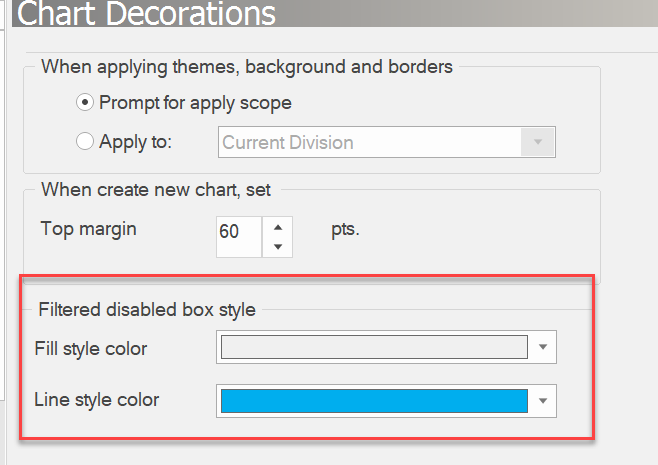
- Filtered disabled box style: When filtering boxes on a chart page you can change the color of fill and border for boxes not included in the filter.
Example: Options set for disabled boxes include light gray fill and blue border.
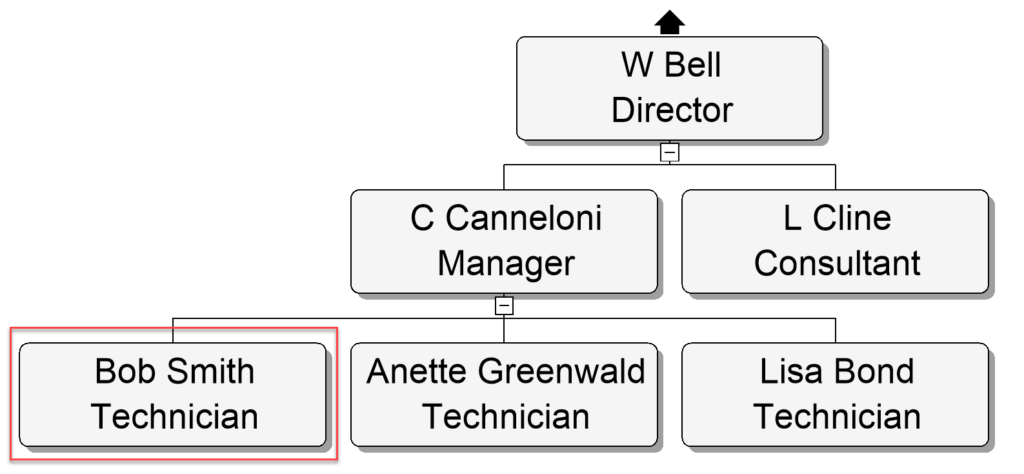
Use a filter showing only those boxes where name contains ‘Bob’. On the left is the original, unfiltered view. On the right is a filtered view.
Options Screen: Dotted line supervisors
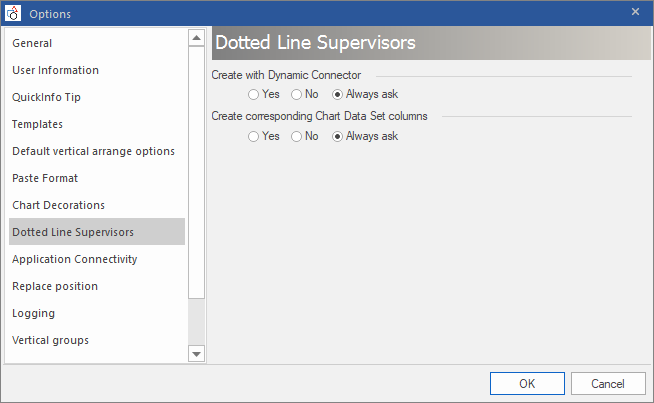
Dotted line connections are supported by the application. Dotted line connections are useful to describe any additional person that a box can report to.
There are two kinds of dotted line connections:
- Dynamic. This is a drawing object that can be established using drag-and-drop between any two boxes that are visible on the chart page.
- Data. This type of dotted line is the result of a data connection between an employee and up to 10 additional supervisors.
Unlike the Dynamic connector, the Data connector registers a data field in the employee box and the Chart Dataset. Dotted lines based on Data can be imported into a chart. Dynamic connections cannot be imported; they must be drawn manually.
Options Screen: Application connectivity

Specify online connectivity for:
- Application Update: Check, download, and install application updates directly from our Website.
- Application License: Automatic License Key update for OrgChart.
- Application Registration: Upload OrgChart Registration data back to our online services.
Options Screen: Replace position
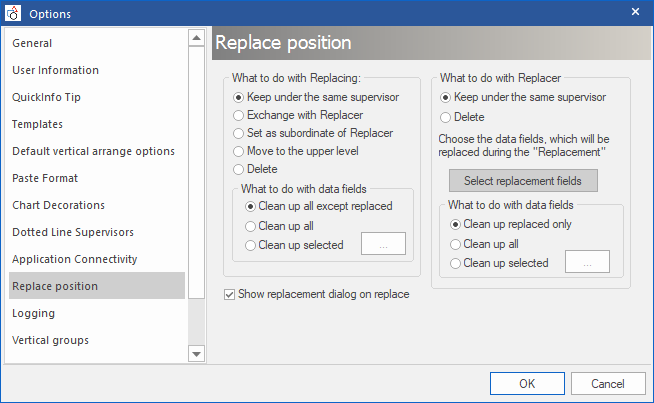
When using the chart interactively for workforce planning projects you can replace one person with another without changing the overall hierarchy structure.
A manager with many direct reports (Replacer) can be replaced with another person (Replacing) in the chart without having to disconnect – and reconnect – all of the subordinates.
This options dialog gives you control over the process.
Options Screen: Logging
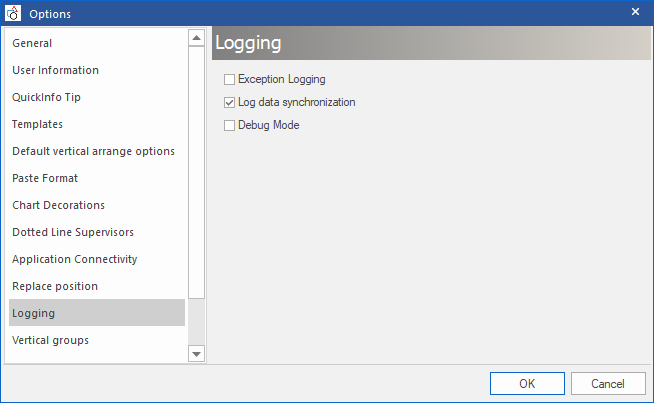
- Exception Logging: Turn on logging during support calls/chat sessions. Turn off during normal application execution.
- Log data synchronization: Logging synchronization for support call/chat sessions.
- Debug Mode: Setting debugging status for Exception Logging. Turn off during normal application execution.
Options Screen: Vertical groups
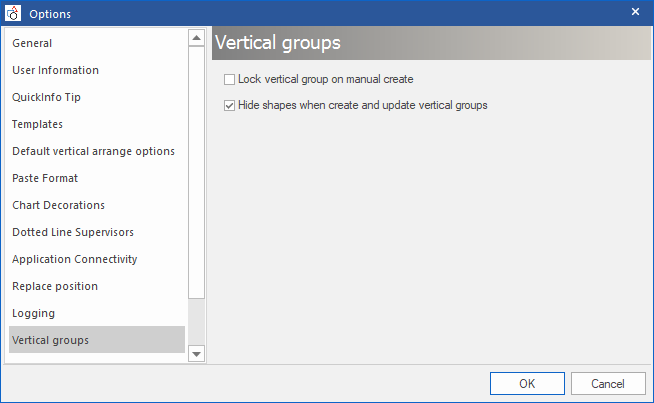
Vertical grouping attributes.
- Lock vertical group: If a Data Resync includes new records reporting to the manager, Locking keeps the group from being updated.
- Hide shapes: Some users like to see the outline of each box in a vertical group. This option prevents the shape (i.e., the box boundaries) from becoming visible.
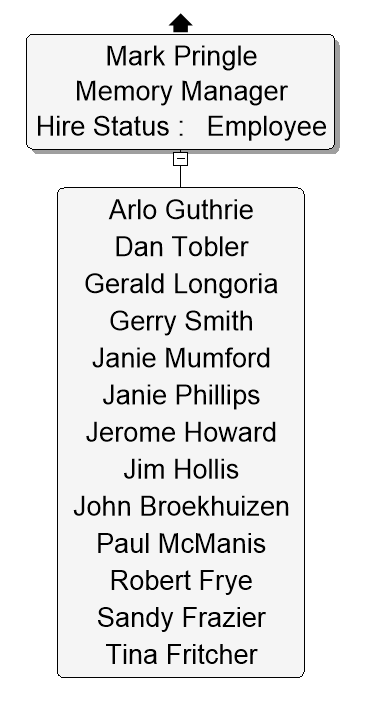
Vertical groups are helpful when there are many people on a chart page, or you wish to group boxes by a field with a particular value.
Example – Before Vertical group:

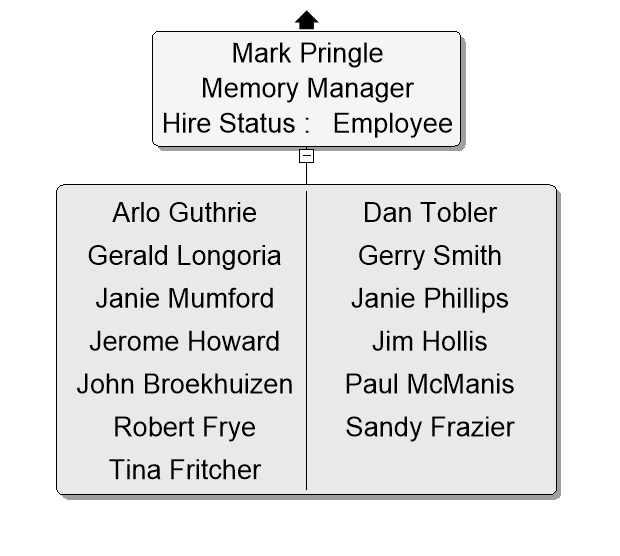
After Vertical grouping, two examples:
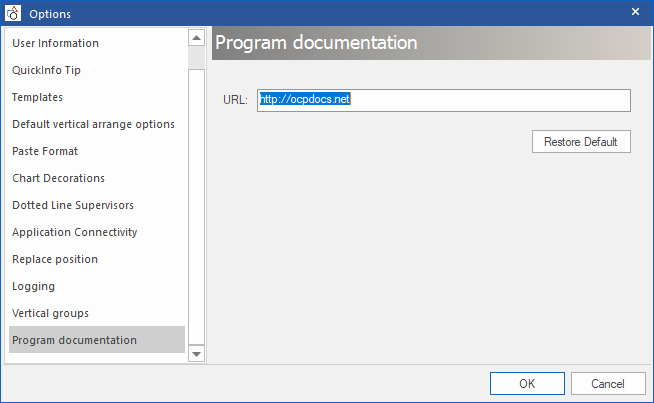
Options Screen: Program documentation