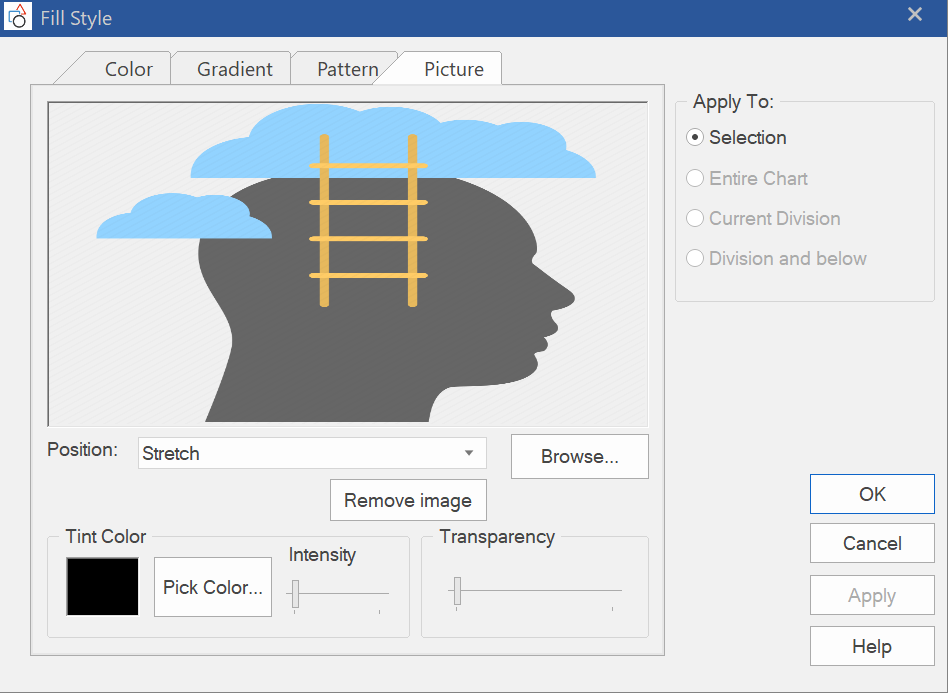
There are a couple ways to change the color of a box, border or connection lines. One way is to use commands on the interface ribbons, or use a local context menu.
Box Color: Selection
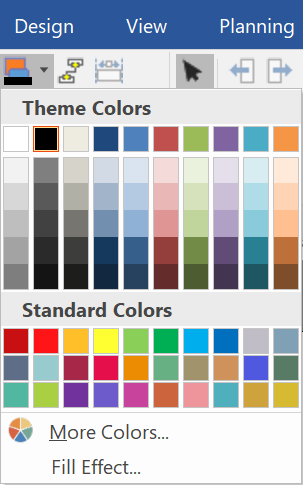
- Using the interface ribbon. Select a box on the chart. Go to the Home tab and click on the Fill Style button.

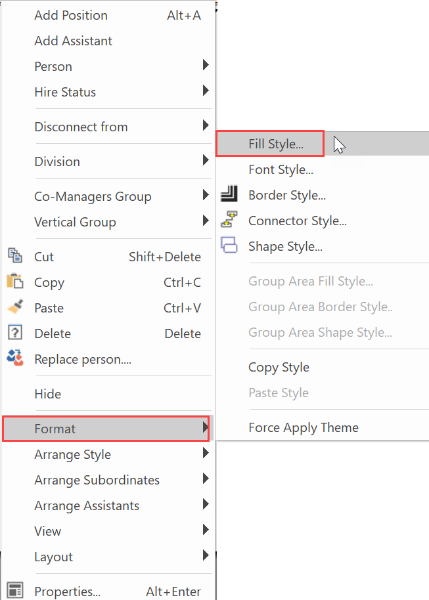
- Using the local, context menu. Right-click on a chart box chart to launch a context menu. When the menu appears, go to Format > Fill Style.
- Right-click in the chart to launch a pop– up menu. When the menu appears, go to Format > Border Style. Once in the Border Style menu, click the Fill button.
Fill Style: Options
Click on a tab to display any of the following four areas.
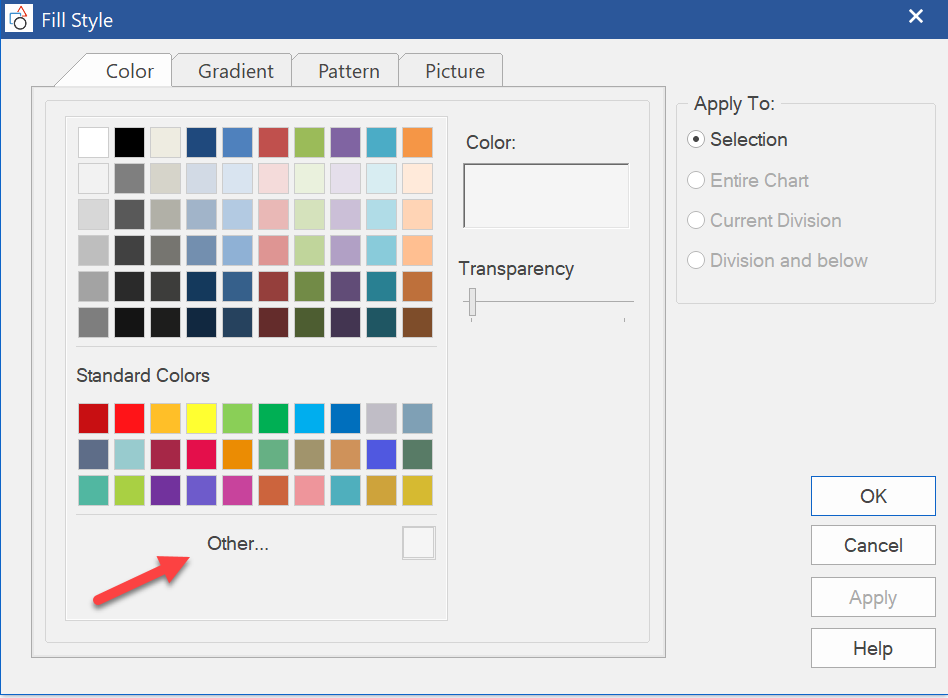
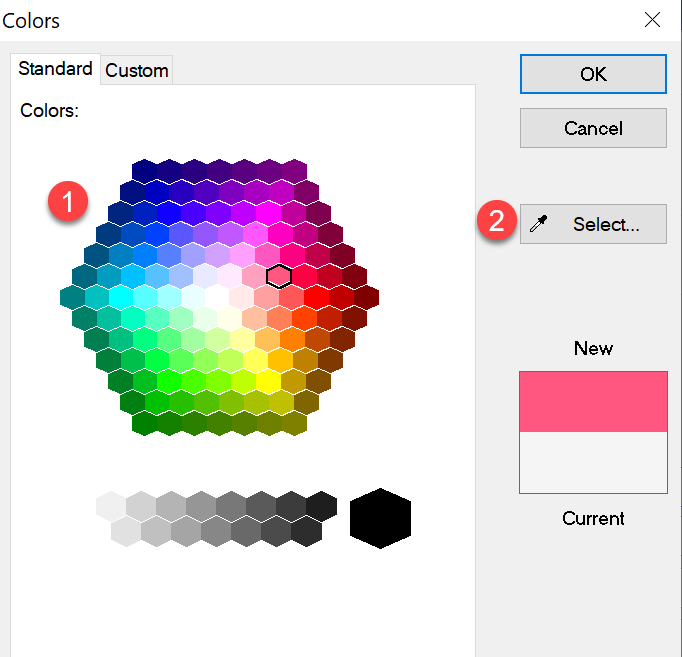
Color: choose a standard fill color or create a custom one by clicking on Other.
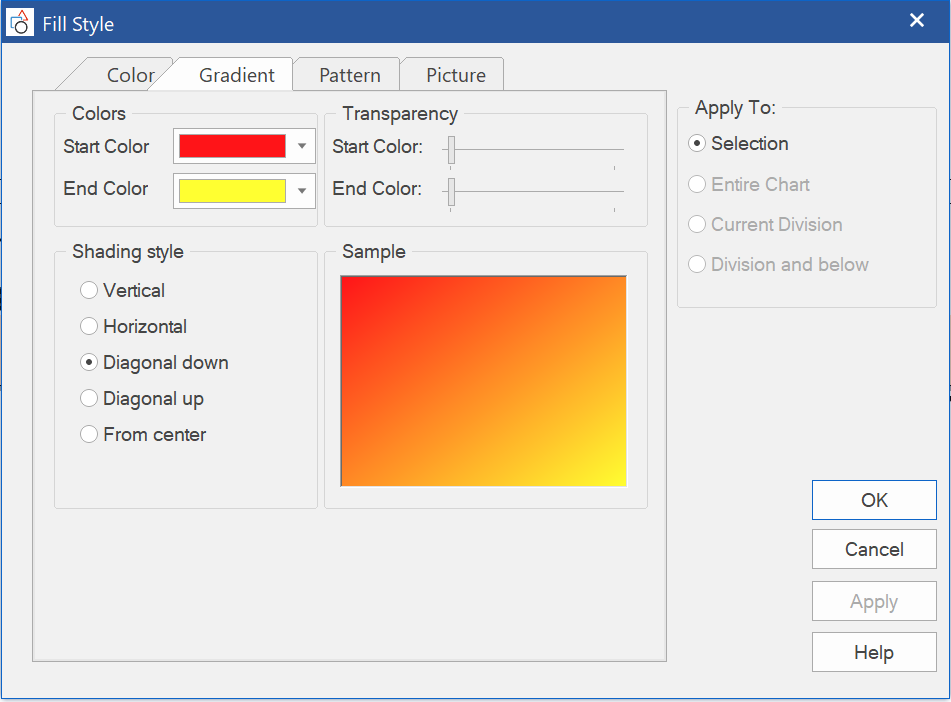
Gradient: choose a gradient (gradual transition) from one color to another.
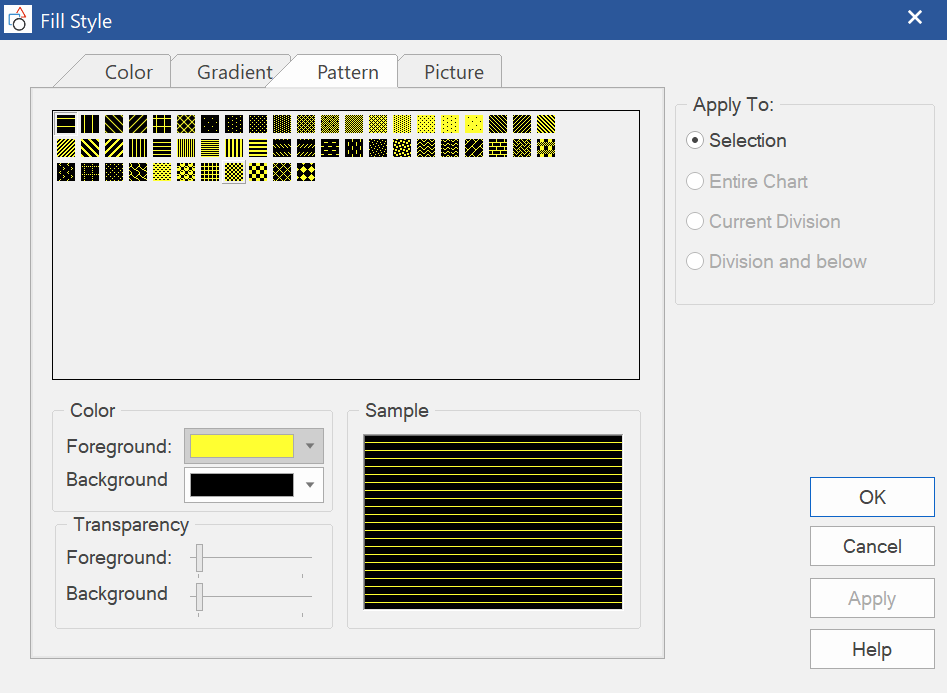
Pattern: choose from a menu of preloaded patterns.
Picture: choose a picture image file. For position the Stretch option may give the best coverage.
