Use the File Import menu item.
Active Directory: Connection string
For AD you need to know the connection string to the server, or at least address of the server where LDAP interface is available (Active Directory for MS servers )
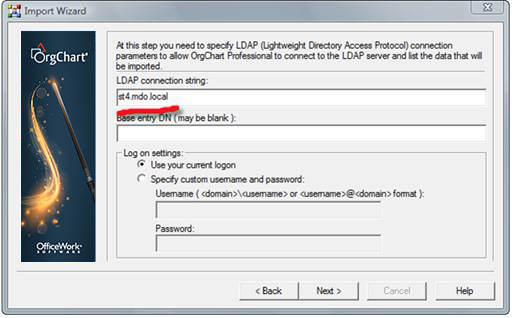
Click Next
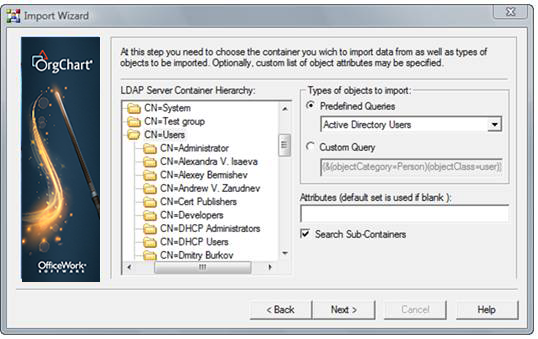
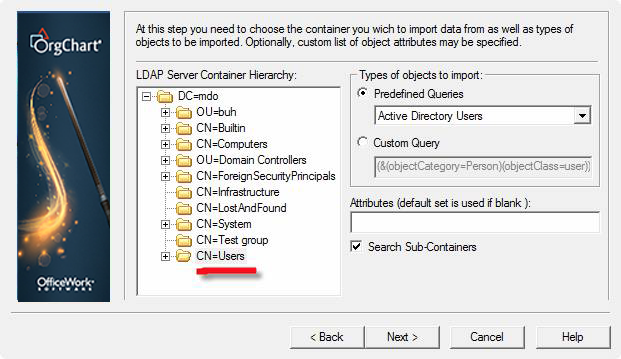
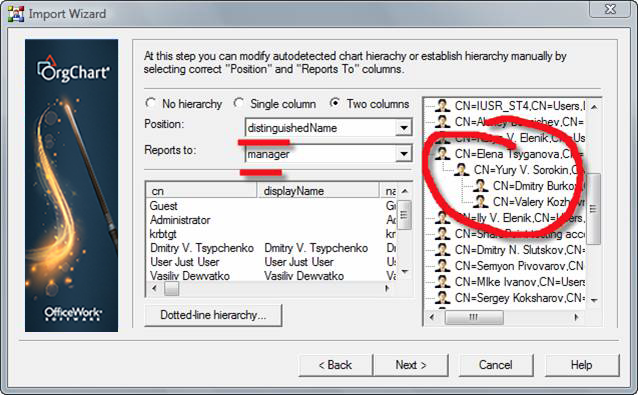
Based on your data you may need to use the “distinguishedName” as a Position and then use “manager” as supervisor. This way hierarchy is defined properly. See the step by step screen shots:
Next
Active Directory: Chart hierachy
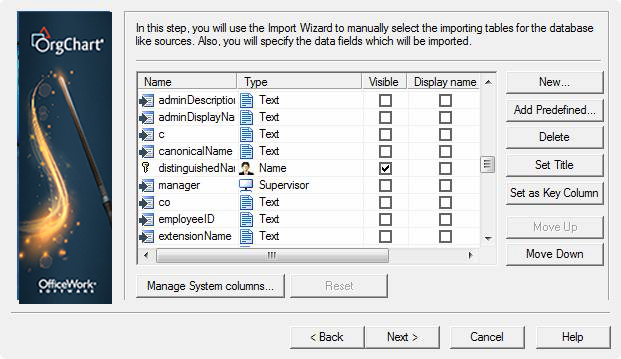
Next – determine fields to show on chart.
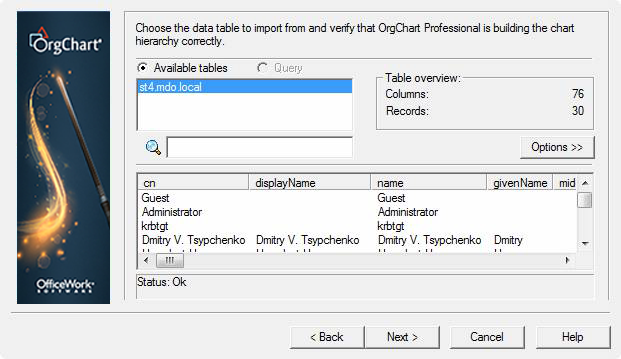
Active Directory: Results

Keep in mind that you can format this chart as desired to show any of the data fields present in AD.